Checkout abandonment statistics show where you should focus your site improvements
I'm often asked about average ecommerce rates by site owners looking to boost their sales. It's a year-round concern with this compilation showing that even for established brands during sale periods, the average add to basket conversion rate is around 12% during a visit with convert to order around half that at 5.6%.
If this sounds poor compared to the conversion rate a physical retail outlet would achieve, that's a fair improvement on ten years ago when we used to speak of a "rule-of-thumb" for average Ecommerce conversion rates of around 2%. The improvement in averages since then suggests the value in conversion rate optimisation. That said, it's inevitable that online conversion rates will be lower than offline with price transparency available through comparison sites and many still researching online and purchasing offline (the ROPO effect).
Reasons for shopping cart abandonment?
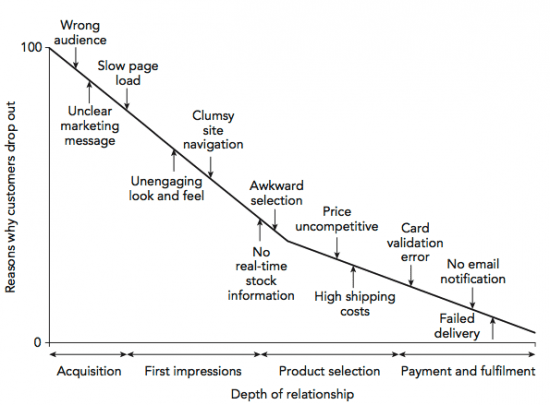
To encourage site owners to think about the factors that lead to checkout abandonment, in Emarketing Excellence we include this graphic to prompt site owners to think about all the factors that can affect conversion. This chart includes both shopping cart abandonment and branding and usability factors that affect the top of the funnel when site visitors are on the home page or browsing category and product pages.

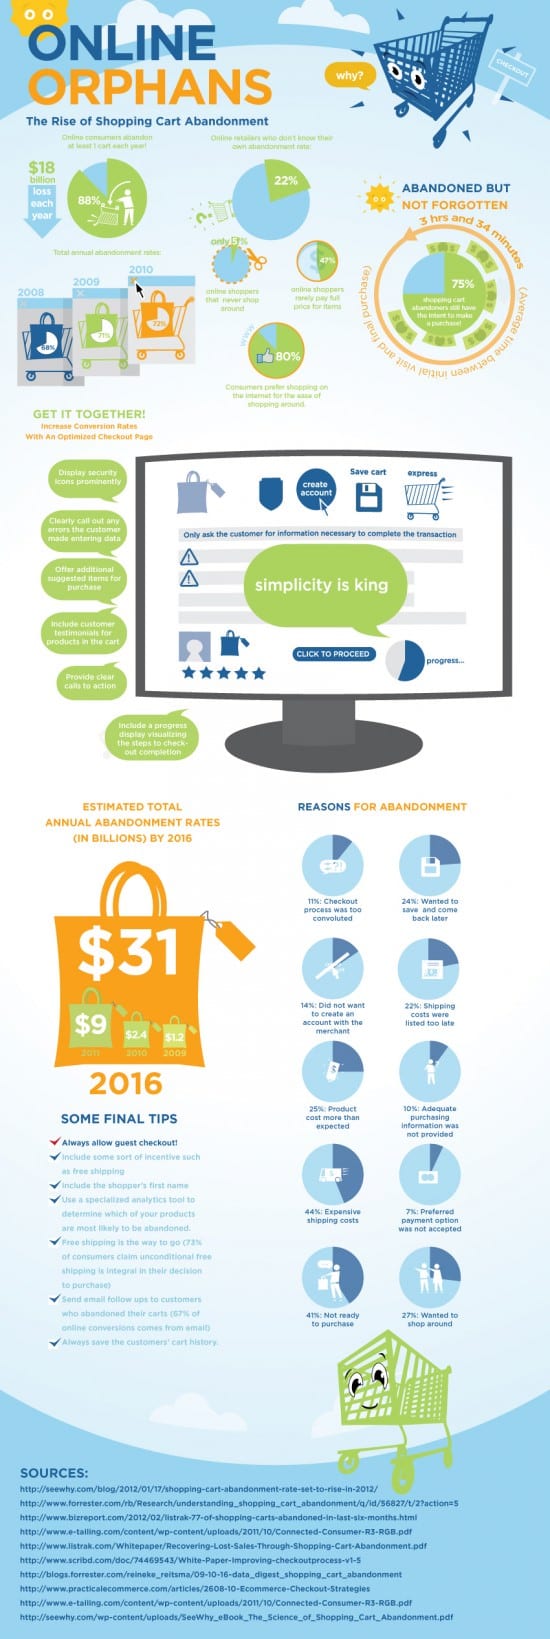
Unfortunately, this chart doesn't show the relative importance of different factors, so I liked this new infographic from Fifth Gear. Which has compiled different research into the reasons why consumers abandon checkout. The main concerns are clear from the pie charts on the bottom right which include:
- Communicating shipping costs
- Convoluted checkout process
- Enforced account creation

The main reports informing this infographic are from Forrester, there is a good summary of their research in this post from SeeWhy on Shopping Cart Abandonment.


