2024 Online marketing adoption statistics compilation
A single source of the best quality digital adoption stats to add to your presentation to get buy-in
How will this guide help me?
To save you time in searching for the latest, most reliable online marketing benchmarks, our digital marketing statistics compilation gives you a single source of the latest and most reliable sources to help you compare your investments in digital channels and your performance against others.
Our digital marketing adoption statistics for our premium members are aimed at saving you time when you need the latest stats for a presentation or report you're working on against a deadline. The visual stats are carefully selected to help you make your case for investment in digital marketing to colleagues or clients.
Who is this guide for?
The guide is aimed at helping anyone who needs to make the case for more or different investment in digital marketing by presenting to colleagues or clients (if you work for an agency or as a consultant).
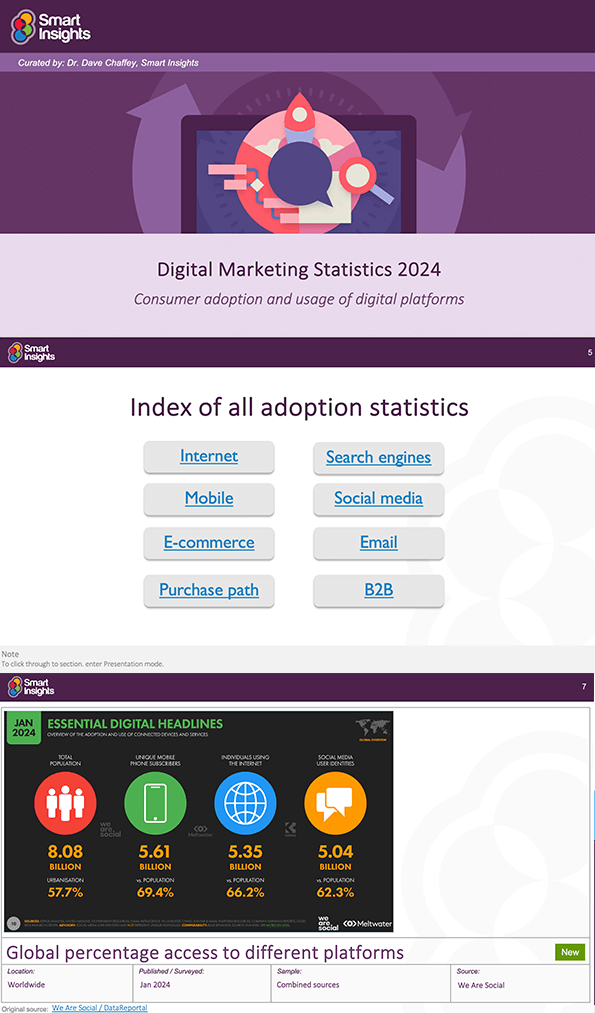
We created our stats guide using Microsoft Powerpoint slides so you can easily add charts to your presentations. It contains nearly 100 slides from the highest quality marketing adoption sources available.
What does the guide include?
This template is structured around statistics of consumer and business preferences and buyer behaviour for these digital platforms and channels:
- Overall Internet adoption – showing popularity of desktop and mobile broadband activities
- Mobile platforms – smartphone and tablet usage and conversion
- E-commerce – category breakdowns of online sales and offline sales influenced by Internet research
- Search engines – the popularity of natural and paid search and consumer behaviour and the impact of search engines on purchase. Voice search and digital assistants.
- Social media – showing the popularity and growth of the different platforms and the most popular activities
- Email marketing – the popularity of different client platforms
- Business-to-business marketing – How different digital channels influence leads and sales
Which regions and countries are covered by the report?
Our members are based worldwide, in more than 100 countries, so we want to help connect you with the most relevant data for your local markets wherever you are.
However, the majority of consumer panels and published research on digital, mobile, e-commerce and social media adoption focuses on English-speaking markets in the United States and United Kingdom plus Europe.
Australia, Canada, New Zealand, Asia Pacific, The Middle East (West Asia), Africa and South America tend to be less well served by consumer panels and reports, but we reference English-language reports on these where they have good quality data. We also reference more detailed global reports referencing individual countries.
Our digital marketing statistics – adoption and usage compilation template gives you a single source of the latest and most reliable sources of online statistics to save you the time of looking through poor quality sources and infographics.
What information is included for each chart?
We love useful infographics, but hate the way they often don’t give the source of the statistics to help review their relevance and validity. So, for each source, we include the following to help support your case or include in your references:
- Source – of original research including a link to the source with full report
- Location of study – regions and countries covered
- Date of publication and survey – we use the most recent source available
- Sample size and frame – type of audience
Latest updates
You will want the most recent data for your presentations, or for your business case. Unfortunately, some of the best research sources aren’t updated regularly or reports are ‘one-off’ so are only relevant for a short period.
Unlike some other compilations and infographics, we will help you be confident you have the most up-to-date data possible since we will:
- Give clear dates, with next known update where possible
- Link to the original source, so you can check report details or for recent updates
- Update our compilations annually
When we report data for earlier years, it’s because it hasn’t been updated in the current year, but we think it’s still useful. We aim to remove most outdated data after two years.
Resource Details
- Author: Dr. Dave Chaffey
- Format: We created our stats guide using Microsoft Powerpoint slides so you can easily add charts to your presentations. Includes over 100 charts structured by channel and with country/regional adoption.
- Related template:
- Online Marketing Benchmarks Statistics Compilation – this companion resource contains conversion rate and media response figures to enable companies to compare their digital marketing effectiveness across industries.
About the author
Dr. Dave Chaffey
 Dr. Dave Chaffey is co-founder of Smart Insights and is a renowned digital marketing expert and speaker. He is author of 5 bestselling books on e-commerce including Digital Marketing: Strategy, Implementation and Practice and was recognized by the Chartered Institute of Marketing in 2004 as one of 50 marketing ‘gurus’ worldwide who have helped shape the future of marketing.

 Starter or Pro Membership is required

 Free membership


