How does your Facebook engagement compare and how can you improve it?
For Facebook company pages, Tabs or Views have always been one of the most important ways to engage an audience more deeply. This can be through a Gated Like page (example); competitions encouraging Email or loyalty club opt-in (example) or games to name but three.
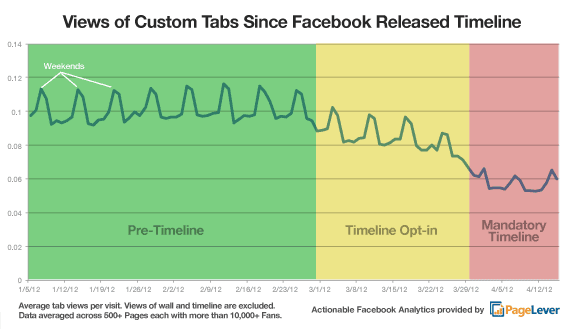
New data from Facebook analytics company Pagelever has shown the impact of the time line since it was introduced on 30th March this year. It also gives a useful benchmark for the level of engagement you should be getting:

The analysis is based on data across 500+ pages that had over 10,000+ fans.
The key insights from this report are:
- Average tab views per visit are relatively low (now 0.06/6%). This gives a benchmark to compare with and a conversion rate within Facebook marketing to work on improving. It also suggests how the design of Facebook limits marketers in engaging their audience in content marketing outside of the Wall. Their own site or community will enable them to encourage engagement more effectively.
- Data Shows Visits to Custom Tabs on FB Pages Cut in Half By Timeline (-53%) - this shows the importance of using visuals on the views panels to make engagement with Apps more as Ford do here
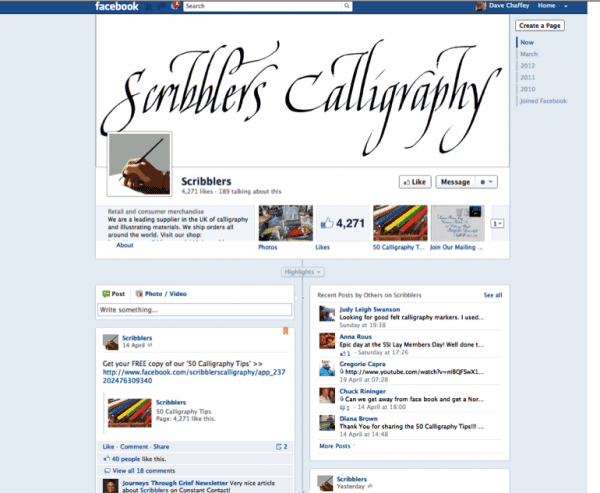
Pinning your View to the top left can also help generate awareness of what is in your tabs as in this example:
- Facebook Users explore Facebook pages more on weekends than weekdays. The implications of this are clear - don't ignore your Facebook at the weekend - use tools such as new Facebook scheduling tool to keep content flowing


