Predict what your email database will do to improve your click rate
The growth in Data Science techniques during the last few years has generated a vast interest in using analytical techniques to optimise engagement on email campaigns. Whether a company wishes to compare the performance of two email templates, compare the performance of multiple email templates or see the association between several characteristics of an email and a single metric, Predictive Analytical techniques allow them to acquire the answers they need.
Below we are going to outline 3 techniques you can implement from ‘getting started’ lists of around 500 subscribers, to highly advanced models geared towards enterprise users.
Understanding Sample Size
For these techniques to make sense, it is important to have a basic understanding of statistical significance and what size of list may be required for your tests to be useful. Very basically, the larger the sample size, the more statistically significant (meaningful) the results will be. However, the bigger impact you expect the test to have, the smaller the sample you require for the results to be deemed “statistically significant”.
As an example, we would expect changing an email subject line from “Acme March Newsletter” to “Your 75% Off Acme Today Only” to have a good impact, whilst changing it to “Acme March News” we would expect less impact. As such, the first test would require a smaller sample size to be “statistically significant” than the second.
Download Expert Member resource – Advanced Lifecycle Email Marketing Guide
A best practices briefing for high email volume businesses to take their email marketing to the next level. This guide is aimed at managers responsible for growing online revenue by integrating different communications channels in larger organisations or businesses that are already fairly sophisticated in their email marketing.
Access the Advanced lifecycle email marketing guide
There are many tools and calculators online and most good newsletters with A/B testing with have inbuilt functionality to assess if your test is statistically significant before you decide to hit send.
Onwards…
1: Getting Started: A/B Testing
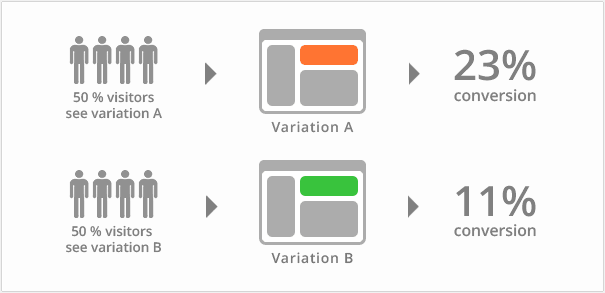
To begin, we will explore the most basic example of Predictive Analytics: A/B Testing. This simply involves showing one version of an email template to a group of users, showing another version of an email template to a different group of users and then comparing the performance of those two templates. Performance could be measured by anything the business is interested in; Open Rates, Click-Through Rates (CTR), Engagement, Conversions etc.

(Source: https://vwo.com/ab-testing/)
The smaller the list size, the more difficult it is to get statistically significant results, so test for major differences and look towards Open Rates as your initial metric. As your list grows, start to look at Click Through Rates and more subtle changes.
2: Moving On Up: Multivariate Testing
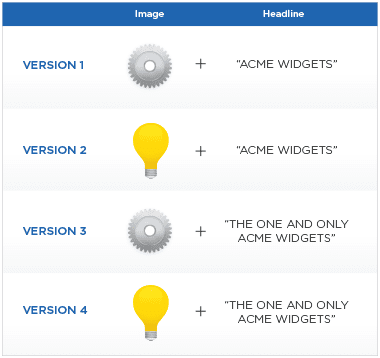
The next example of Predictive Analytics is an enhanced version of A/B Testing; Multivariate Testing. Multivariate Testing makes multiple email templates based on the combination of multiple variables. These then get sent to several groups of different people, from where the business can see which combination performed the best.
With an A/B test you compare “Email A” to “Email B”, but with Multivariate testing you could compare A to B to C to D…or you could compare the effect of several individual differences between A and B.

(Source: https://www.optimizely.com/resources/multivariate-testing/)
Put simply, Multivariate Testing is a bigger version of A/B Testing, running multiple A/B tests simultaneously.
As you can imagine, the more versions you are testing, the larger the sample size required to find a “winner” with statistical significance.
The Problems With Split Testing
The above examples of Predictive Analytics have many advantages, one of which is their simplicity, however, there are problems with both these techniques.
First, they only test for a difference between variables and do not assess a correlation between the values of one variable against another. They provide answers on the differences between variables, but do not provide information on whether the values of those variables correlate or are statistically associated with the metrics which a business is interested in.
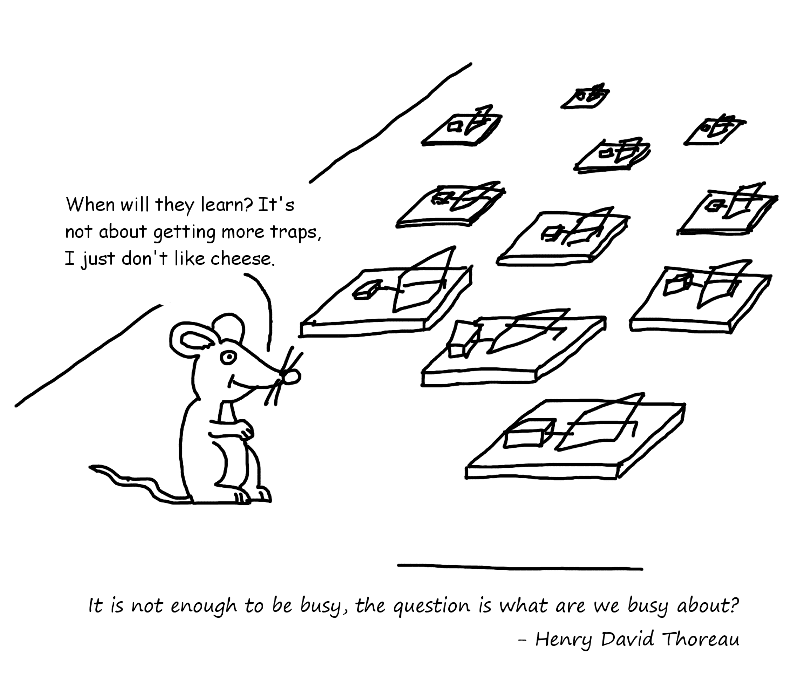
Secondly, and more seriously, the conclusions of A/B testing and Multivariate Testing need to be taken with a pinch of salt. Because two different email templates are sent to two different groups of people, any differences in the results found between those two templates might not because of the template per se, but are rather a difference between those two groups of people. Because we cannot show two different email templates to the same group of people, it must always be remembered that it may not be the design of the template that’s driving changes, but rather the personality, motivations, time available and aims of the people who received those emails.

(Source: http://cartoontester.blogspot.co.uk/2011_07_01_archive.html )
In this situation, another technique has to be introduced which assess the correlation or association between variables. Referred to as the “Granddaddy of Supervised Artificial Intelligence”, a Regression Model can mitigate the problems of A/B tests.
3: Advance Techniques: Beyond Split Testing
If you wanted to find out if patterns in your old emails, whether they may be subject line, time of day, use of pictures, use of offers or amount of text influenced the CTR of that email, a Regression Model can answer that very question.
A Regression Model fits a line of best fit consisting of several variables (for example, send time, subject line, content etc) against one individual variable (for example, the CTR). The several variables are referred to as Predictor Variables, while the individual variable they’re fitting against is called the Response Variable.
The idea of Regression Testing is to use the values of the Predictor Variables to predict the value of the single Response Variable.
That’s exactly what Adoreboard did using their latest tool toneapi for low cost airline EasyJet in order to see if there was a correlation between emotion and click through rate. The team analysed 30 transactional email templates for emotional content. The analysis was then compared to the CTR that each template received from millions of EasyJet customers. Using the emotions as Predictor Variables, an overall correlation was found between emotions and CTR (the “Response Variable”), allowing the templates to be optimized accordingly. The result was a click through uplift from 13.4% to a predicted click through rate of 23.7%.
Regression Models are regularly used to make predictive decisions in other situations. An example of this was famously reported a few years ago when US giant Target developed a Regression Model which could predict whether a customer was pregnant or not, based on their purchase history. In this example, the predictor variables were the purchases the customers made, while the response variable was whether a customer was pregnant or not.
For large players who have a lot to gain (or loose!) from their email communication, regression testing can have incredible impact, although it is not something that can easily be offered as an ‘out of the box’ solution.
What are the 3 main techniques and how do they differ?
- A/B Testing is only interested with finding a difference between two copies. Depending on what you are testing, you could potentially get started with a list size of 500+ subscribers, testing email subject lines against open rates.
- Multivariate Testing is very similar to A/B testing, but runs multiple simultaneous tests. Gaining statistical significance depends on a large number of factors, Mailchimp recommends a minimum list size of 5,000 subscribers.
- Regression Testing is interested in the occurrence of several variables (Predictor Variables) against a single measurable target (Response Variable). It is recommended for much larger enterprises sending large quantities of email and will require the services of a data analyst, data scientist or statistician.
In conclusion, we recommend first getting started with basic A/B testing of a single, yet notable variable such as subject line. As your list grows, consider speeding up your tests with Multivariate Testing. And once your send volume is at enterprise level and business revenue is significant, consider Regression Testing and Modelling, which can offer succulent insights and improvements to your email marketing.

David Sands is a Data Scientist at
toneapi.com and
Adoreboard working on emotional insights for global brands.


 David Sands is a Data Scientist at


